Console & Logging
The console panel logs every request and response so you can inspect what was actually sent and received.
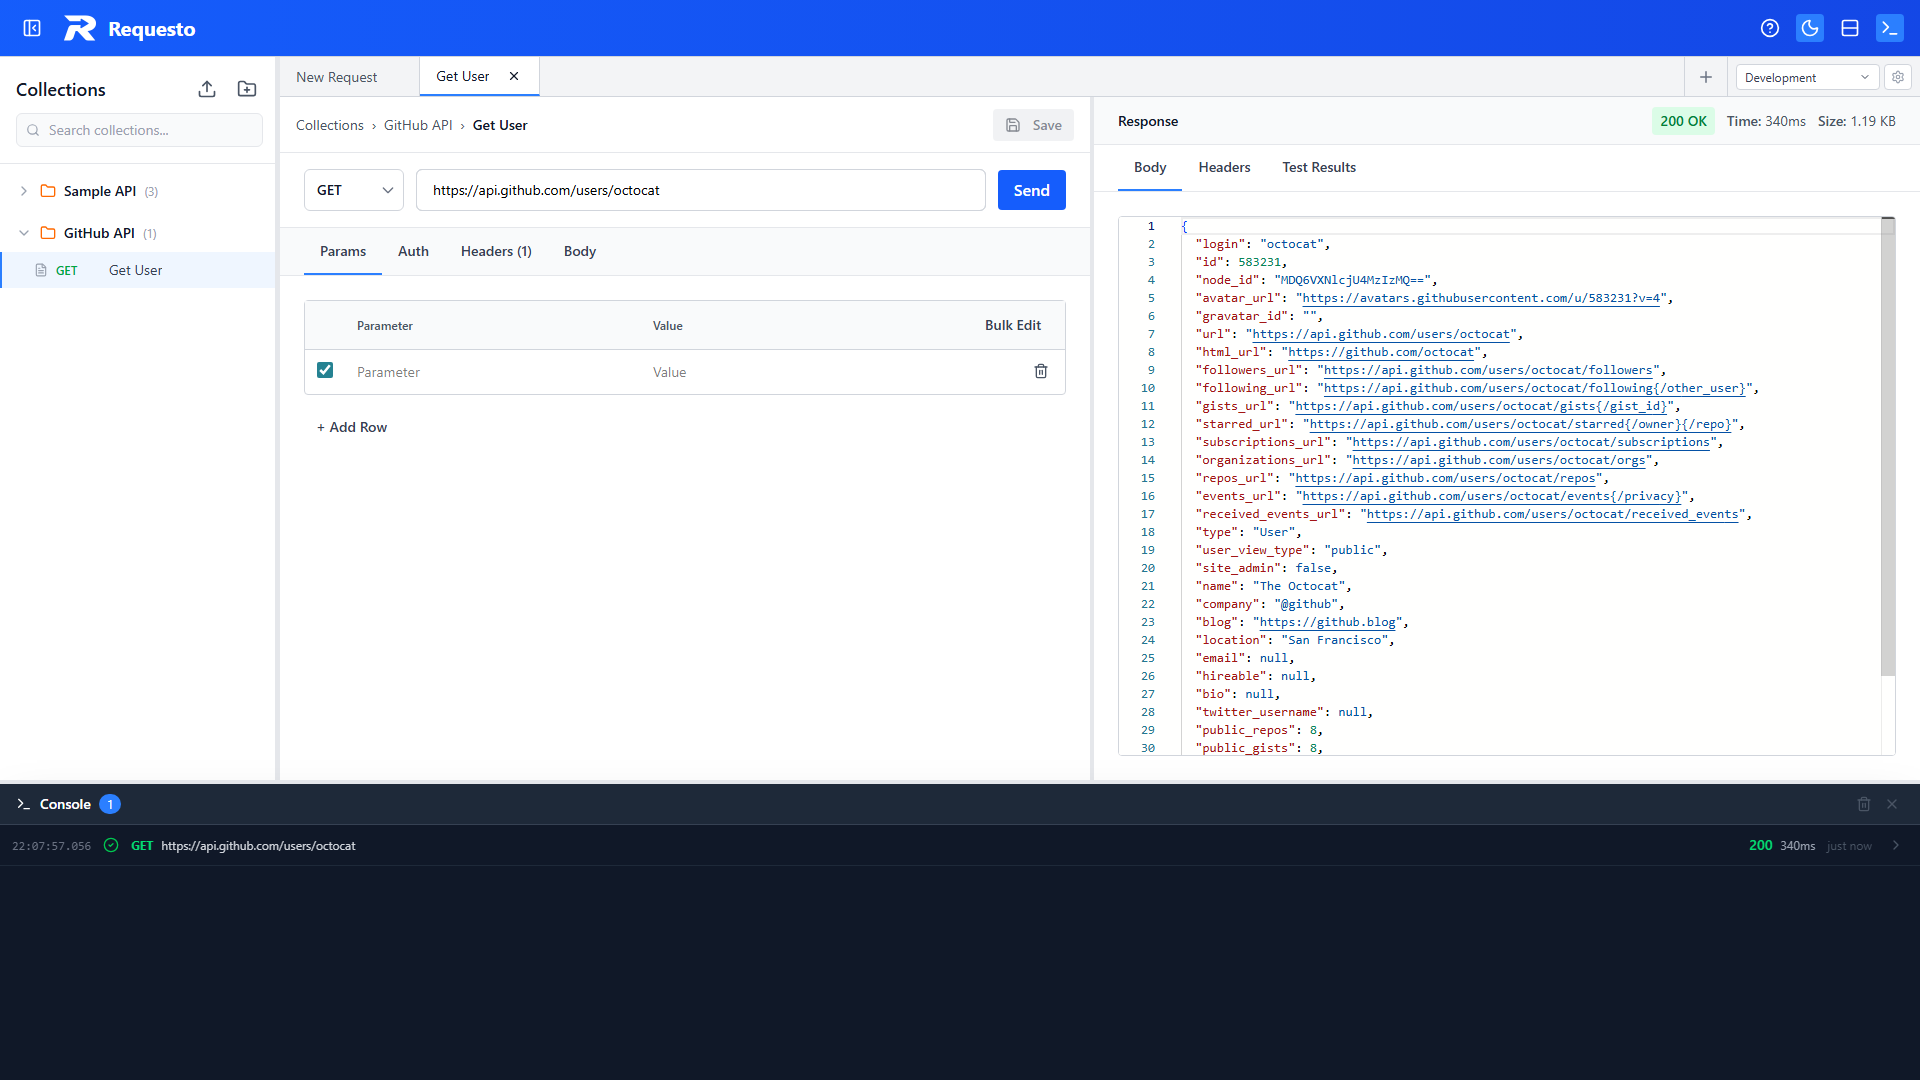
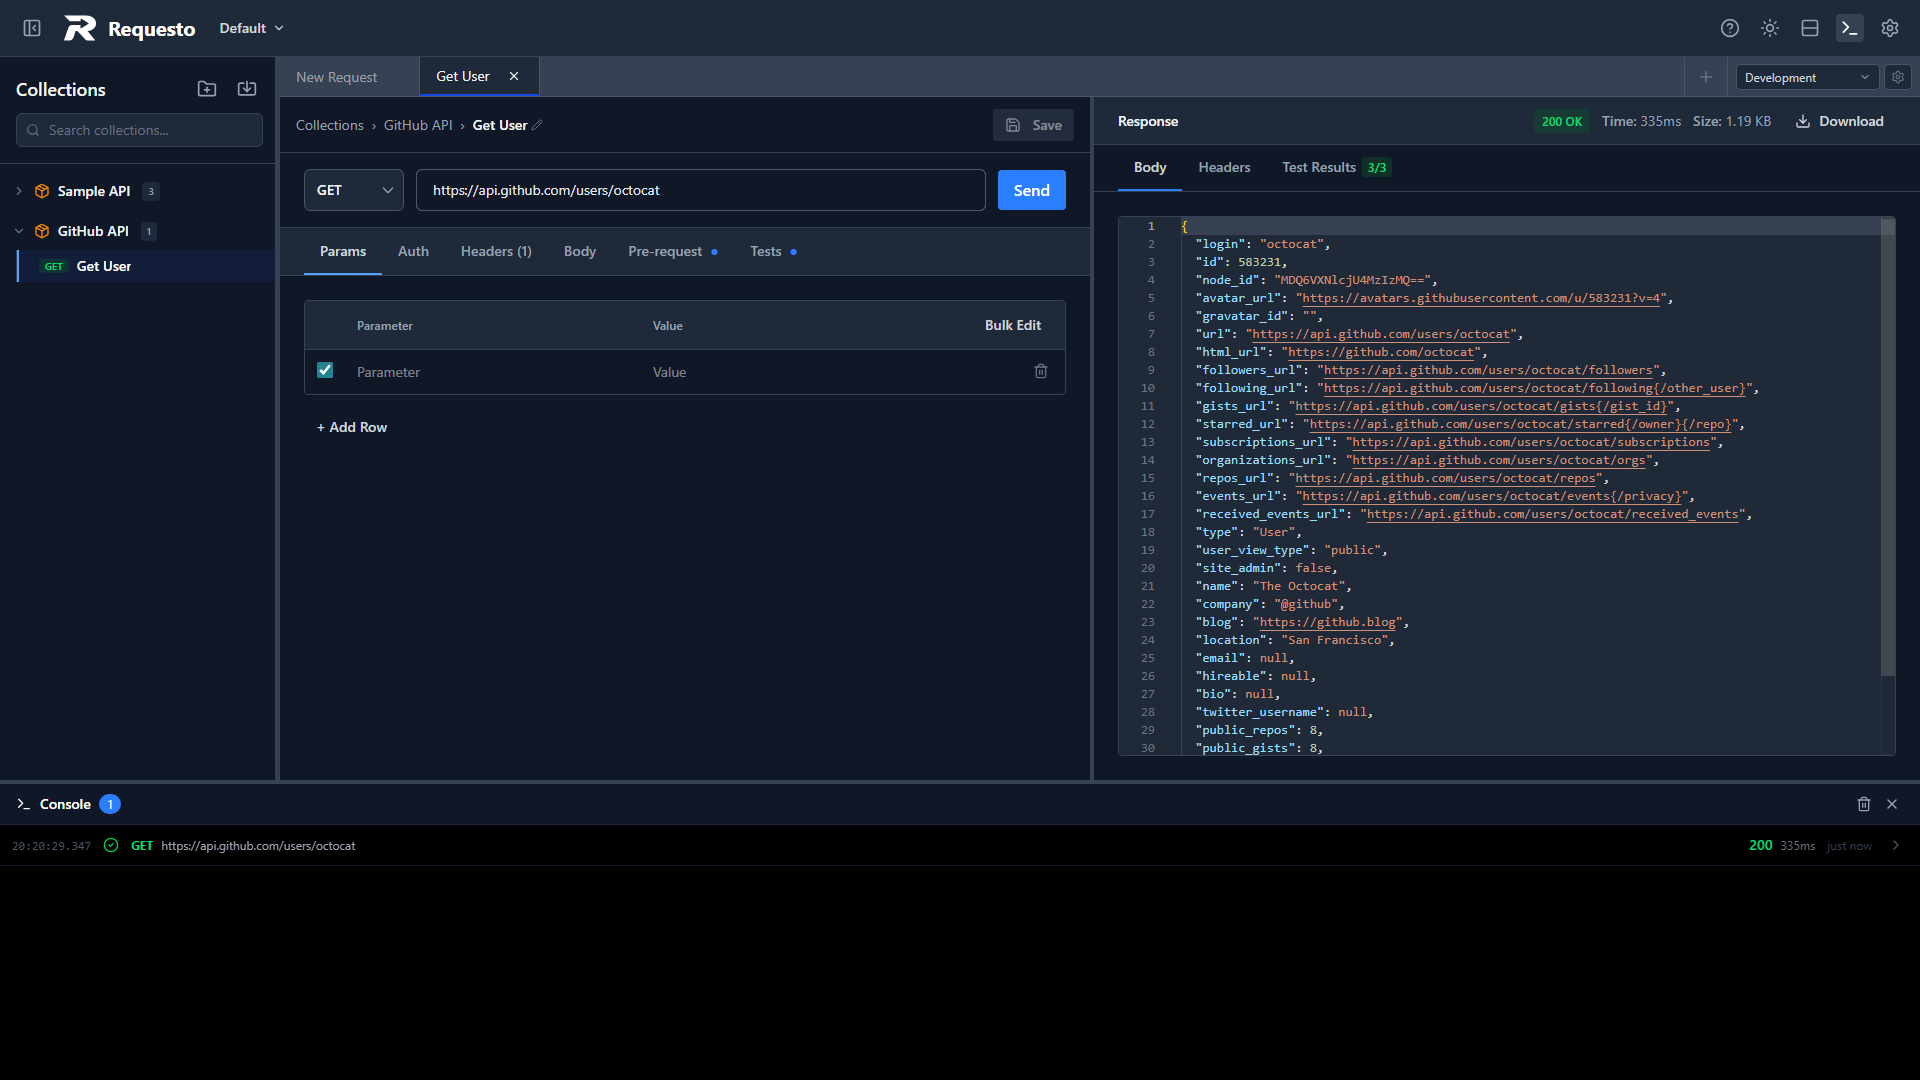
Opening the Console
Click the Console bar at the bottom of the request view to expand it. Drag the top edge to resize. Click again (or the X) to collapse.
How Logs Work
Each time you send a request, the console creates a group with up to three entries:
- Request (blue) - method, URL, headers, and body as sent (after variable substitution)
- Response (green) - status code, headers, and response body
- Error (red) - if the request failed (network error, timeout, etc.)
Groups are shown newest-first. Each group shows the method, URL, status code, and a relative timestamp ("2s ago", "5m ago").
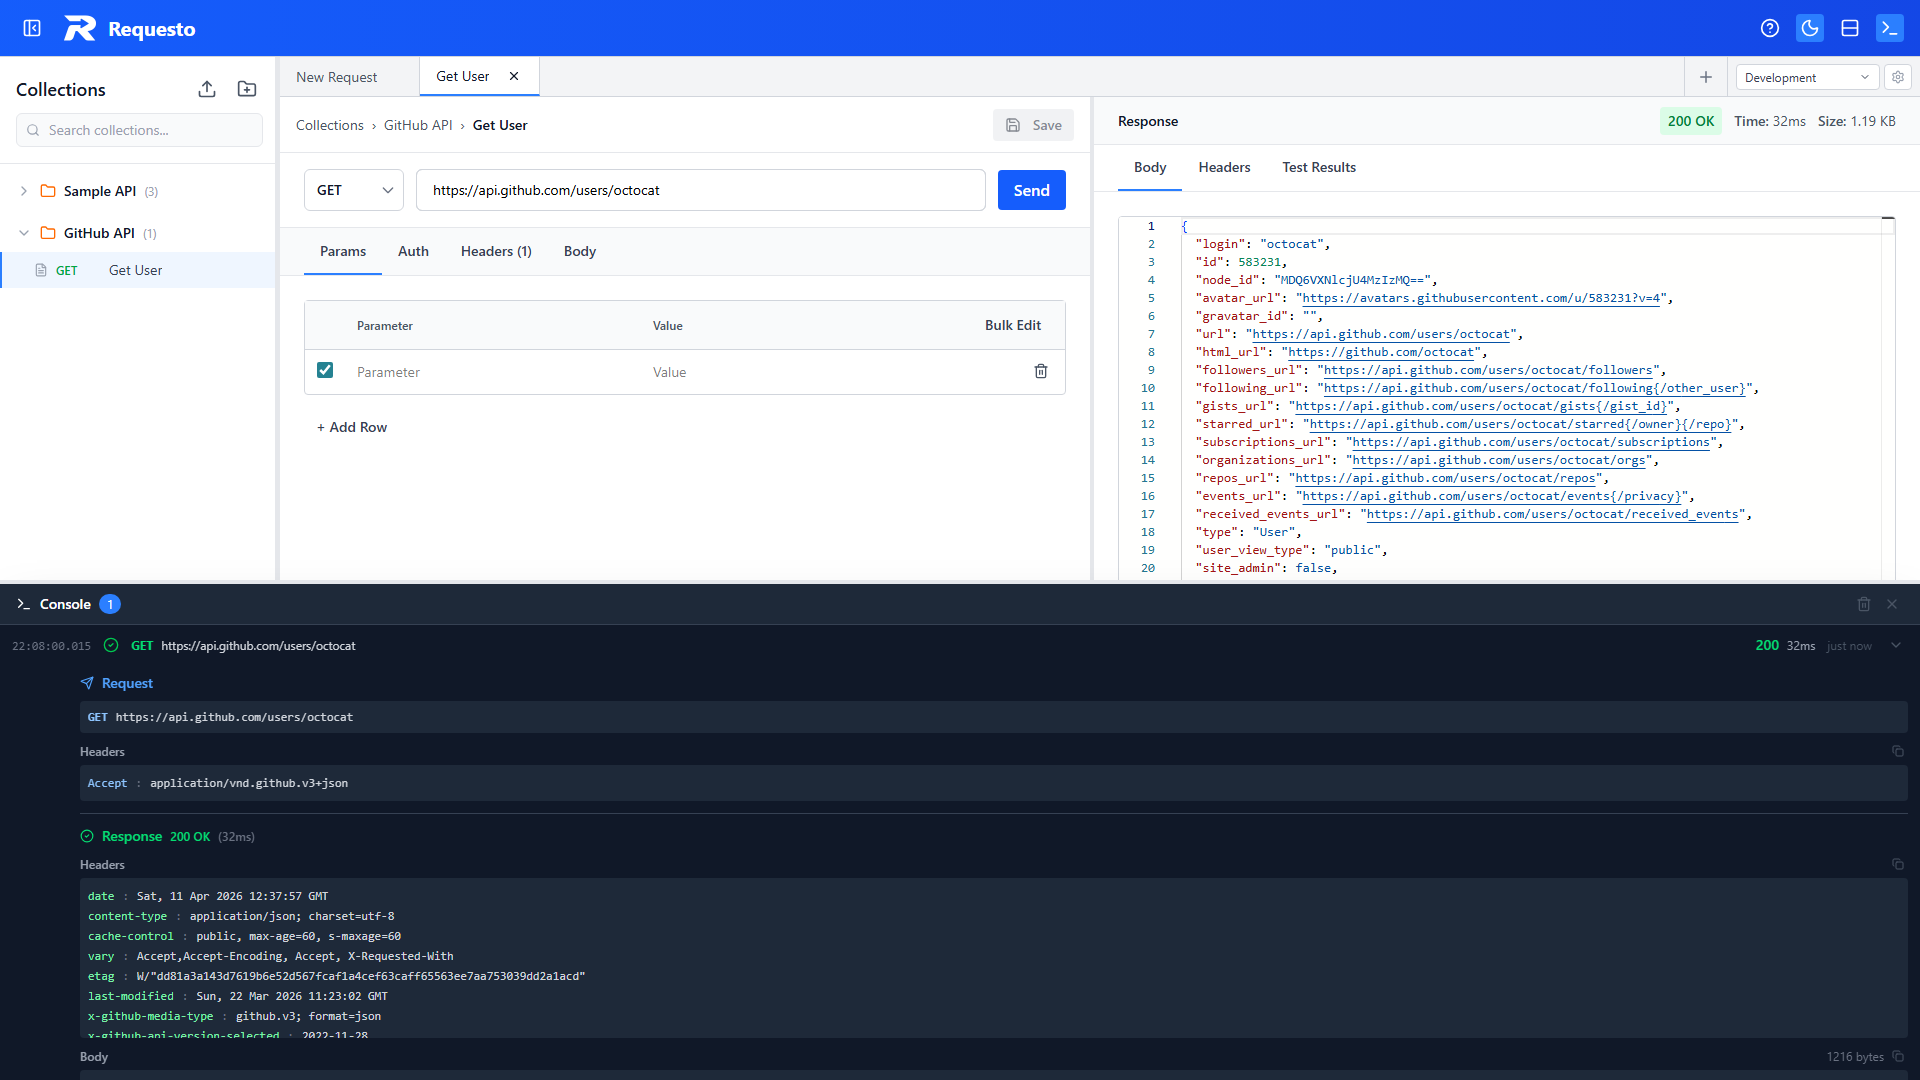
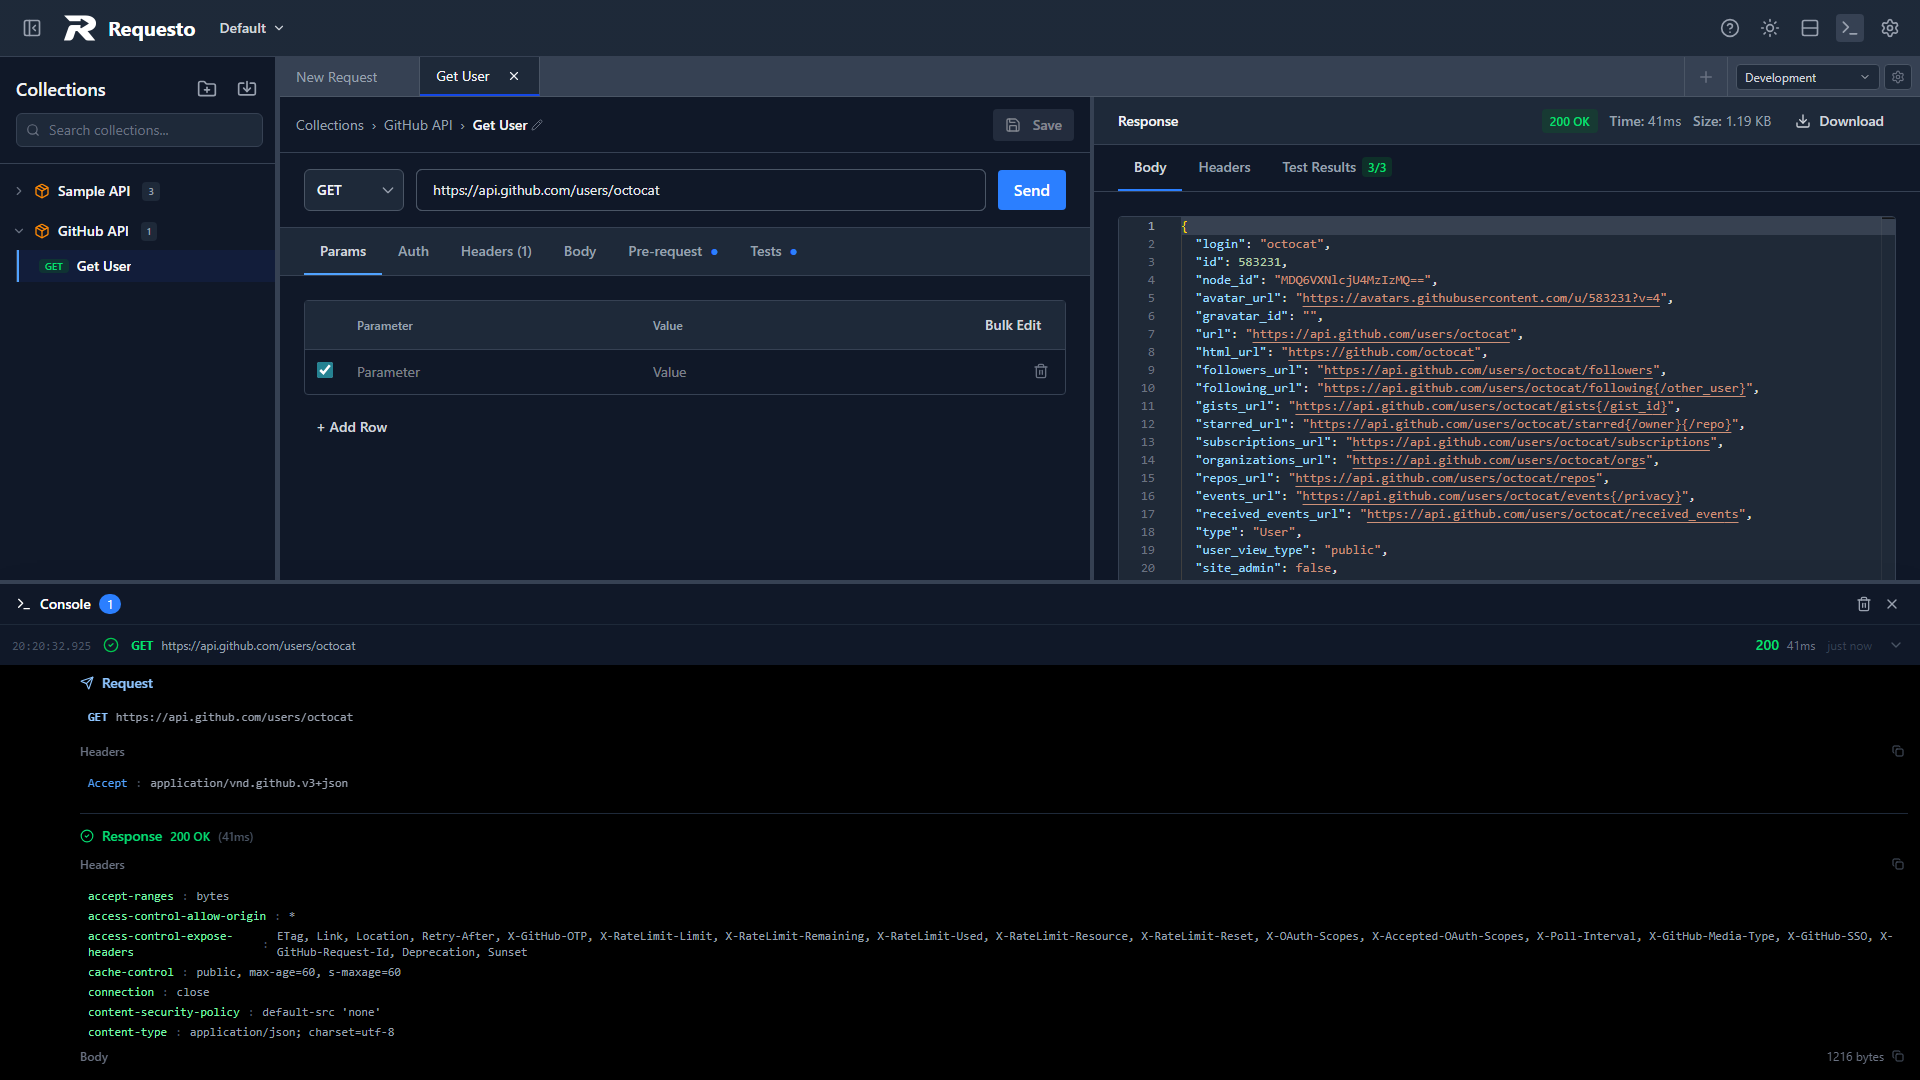
Expanding a Group
Click a group row to expand it. Inside you'll see collapsible sections for each log entry (request, response, error). Click a section header to toggle it open.
The expanded view shows:
- Request: method, URL, headers (formatted key: value), and body
- Response: status code with color coding, response headers, and body
- Error: error message
Status Colors
| Status Range | Color |
|---|---|
| 2xx | Green |
| 3xx | Yellow |
| 4xx | Orange |
| 5xx | Red |
Copy to Clipboard
Each expanded log entry has a copy button that copies the full details as JSON to your clipboard.
Clearing Logs
Click the trash icon in the console header to clear all logs from the current session.
Storage
The backend keeps the last 100 request/response records in data/history.json. Console logs in the frontend are held in memory for the current session.